Remote Debugging with Chrome for Android [video + tut]
Be sure to Follow @wesbos on twitter for more like this :)
Earlier this week Chrome for Android was finally announced and web developers everywhere celebrated. Not only did we have one of the best browsers now on our phones, but we had access to remote debugging, which we have been waiting for and talking about forever.
Remote debugging allows a developer to use the browsers developer tools from a desktop computer while inspecting and manipulating the website on the mobile device - all in real time! This means you no longer have to use alert boxes to debug a problem that only reproduces on the phone.
So, while there have been a few earlier implementations of something similar, Chrome for android brings us the rock solid experience that we have been waiting for. Without further ado, here is a quick tutorial on how to get remote debugging up and running.
Update: I'd like to specifically point out that Opera Mobile has has this functionality for quite some time now and you're able to do it without USB or a SDK (miketaylr had an awesome presentation on it at jQuer conf). So, develop in whatever browser you prefer and use both these tools when you're debugging that specific mobile browser.
What you'll need
* An android phone that runs Ice Cream Sandwhich

* Google Chrome beta from the Android Market

* A USB to plug in your phone

* The <a title="Android SDK with Remote Debugging" href="http://developer.android.com/sdk" target="_blank">Android SDK </a>if you haven't already installed it.
http://www.youtube.com/watch?v=n_7Wyj6DciY
Installing the Android SDK
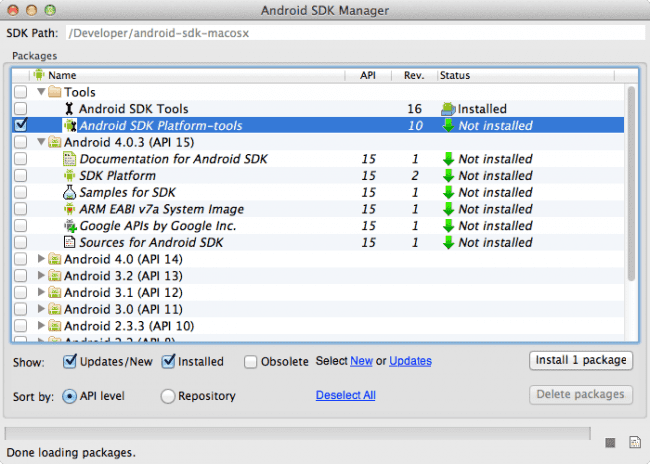
This step is really quick because you either already have the android SDK installed or if you need to install it, we just need a tiny little part of it - nothing related to the native android development. These instructions are for OSX but they are very similar to Windows, the one differnce being that Windows users must install the USB Driver. Go ahead and download the SDK, unzip it, and put the entire `android-sdk-macosx folder somewhere other than your downloads folder. I reccomend keeping it in in /Developer/android-sdk-macosx/. Double click android` file and the Android SDK manager will open up. Uncheck everything except the "Android SDK Platform-tools" and click "Install 1 Package"
You'll also probably want to add the /platform tools/ to your $PATH so you can access the adb command from any folder rather than just in the platform tools folder. Run the following command from your terminal.
export PATH=$PATH:/Developer/android-sdk-macosx/platform-tools
Preparing your phone
There are two things you need to enable to make remote debugging. Plug your phone in via USB and set the following two options.Check the box for
Settings → Developer options &rarrl USB debuggingOpen Chrome on your phone →
Settings → Developer Tools → check Enable USB Web debugging
Starting the remote debugging!
Now that we have everything in place and our phone is plugged in, we can start the remote debugging server. Fire open your terminal and type the following command and hit enter:adb forward tcp:9222 localabstract:chrome_devtools_remote
Occasionally I'll either get no response or a "device not found" error. I've found that running the command adb kill-server and then the code above resurrects the situation.

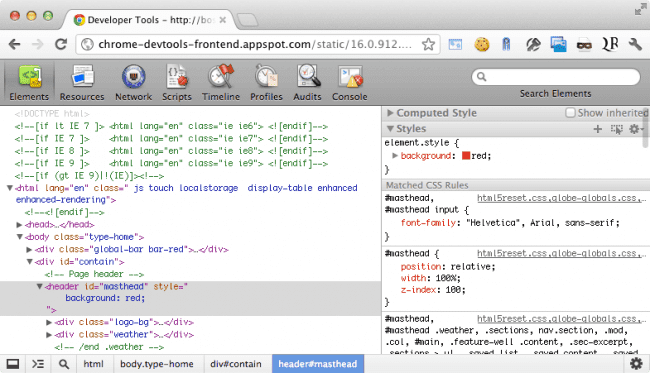
Now browse to http://localhost:9222 on your desktop version of chrome and you will see a list of currently open tabs on your phone, clicking one of them will reveal the Chrome dev tools interface that you're used to. Instead of having the window above the tools, its on your phone!

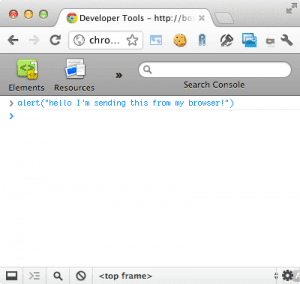
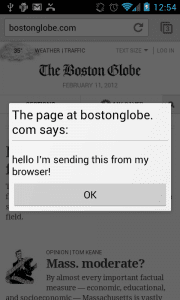
You can use it just as if you were using your regular dev tools. Go ahead change the CSS background colour or send an alert over the console.


Thats all folks!
Thats all, its an incredible useful tool that we have all been looking forward to. Now we wait with baited breath for Safari on IOS to turn on remote debugging.
If you liked this tutorial, be sure to give me a follow on twitter :)
Find an issue with this post? Think you could clarify, update or add something?
All my posts are available to edit on Github. Any fix, little or small, is appreciated!